Davis County Housing Market Report — July 2026
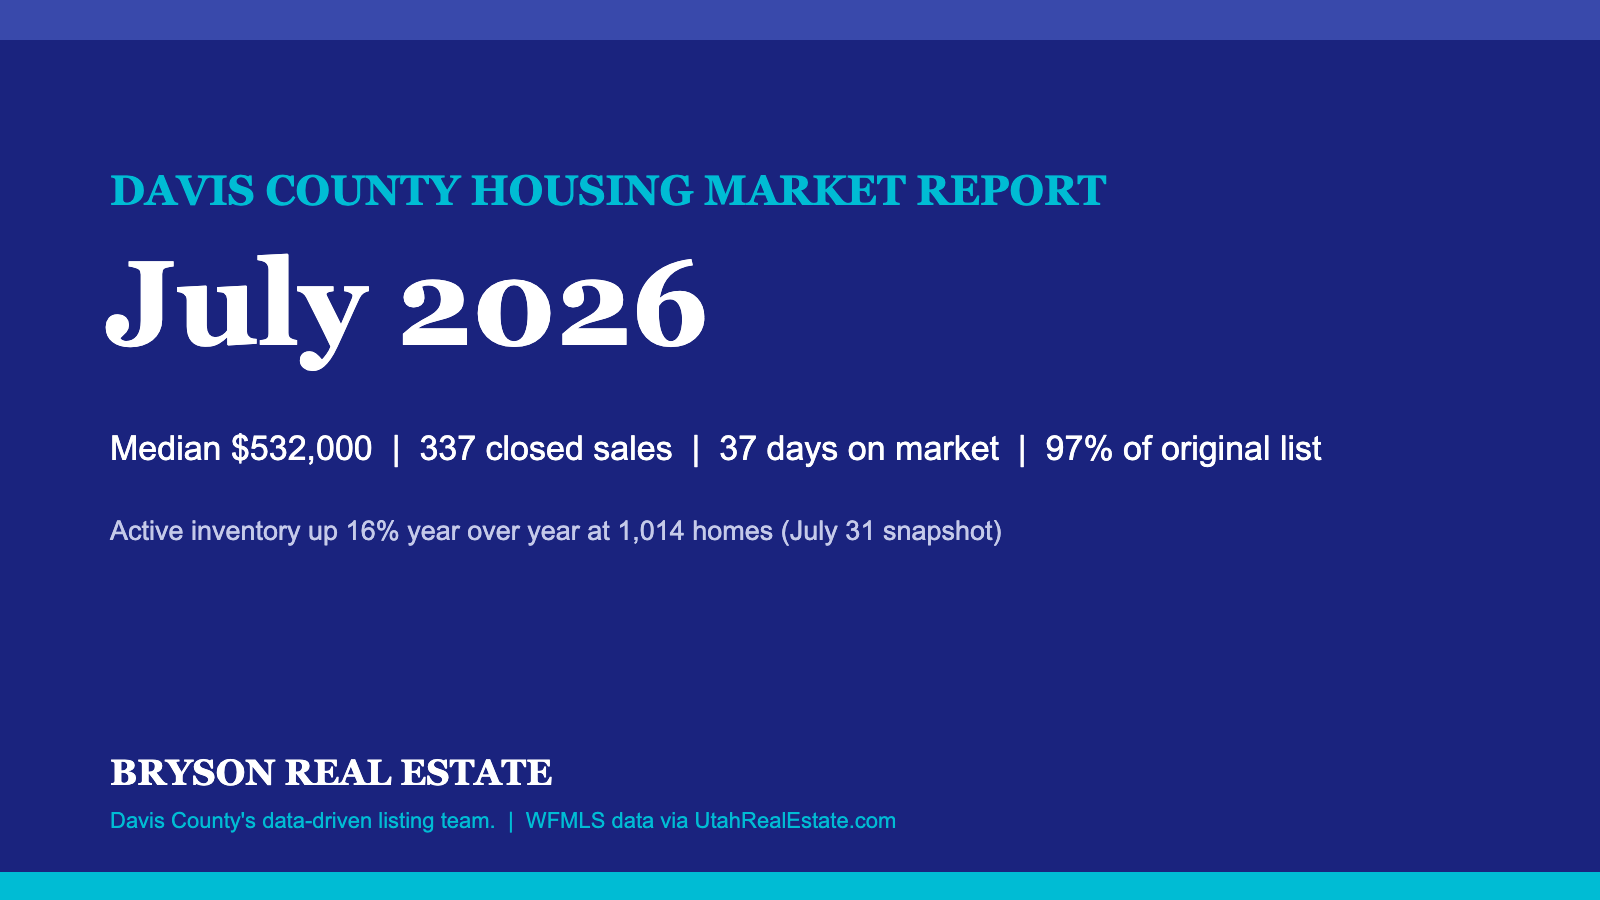
Davis County’s housing market spent July 2026 doing something it has done all year: holding steady on price while giving buyers more to choose from. The county recorded 337 closed residential sales at a median price of $532,000, with homes going under contract at 97% of their original asking price. The bigger story is on the supply side, where active inventory finished the month at 1,014 homes, up 16% from the same date a year earlier.
July 2026 by the Numbers
| Metric | July 2026 | June 2026 | July 2025 | Change (YoY) |
|---|---|---|---|---|
| Closed sales | 337 | 347 | 342 | -1.5% |
| Median sold price | $532,000 | $540,000 | $535,500 | -0.7% |
| Median original list price | $550,000 | $550,000 | $560,496 | -1.9% |
| Sold-to-original-list ratio (median) | 97% | 98% | 96% | +1 pt |
| Median days on market | 37 | 35 | 32 | +5 days |
| Median price per square foot | $229.13 | $227.96 | $226.35 | +1.2% |
| Dollar volume | $199.96M | $210.47M | $203.12M | -1.6% |
| Active listings (month-end snapshot) | 1,014 | — | 873 | +16.2% |
| Under contract (month-end snapshot) | 270 | — | 338 | -20.1% |
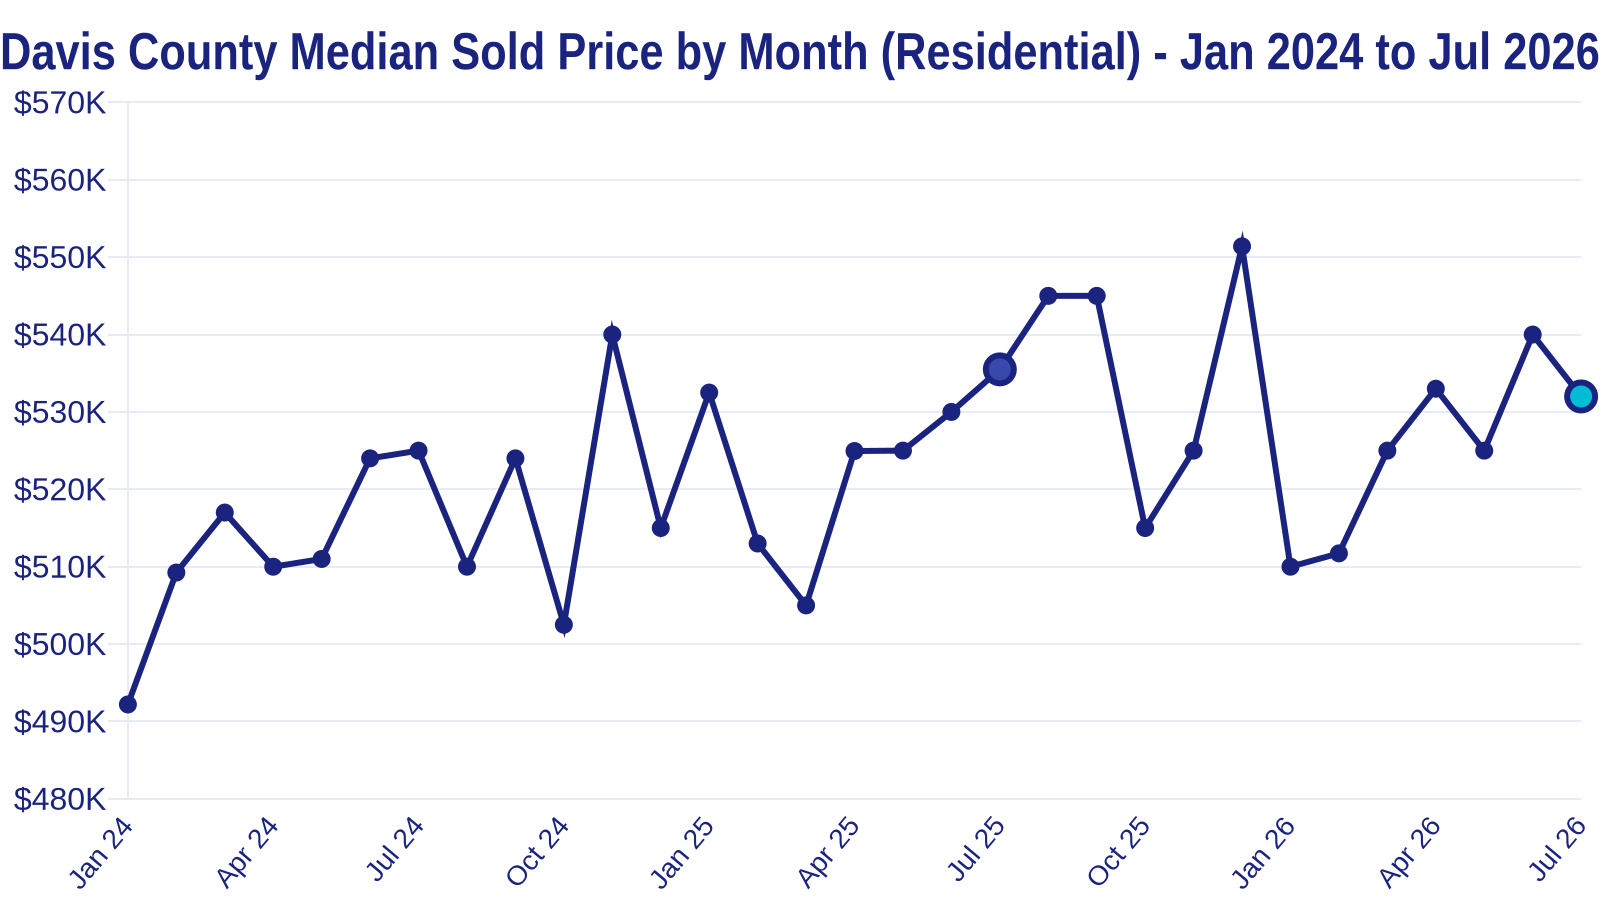
The median sold price of $532,000 sits within the same narrow band Davis County has traded in for more than two years. Since January 2024, monthly medians have ranged roughly from $492,000 to $551,000 with no sustained breakout in either direction. July came in 0.7% below July 2025 and 1.5% below June — ordinary month-to-month movement, not a trend change.
Inventory: The Number That Keeps Climbing
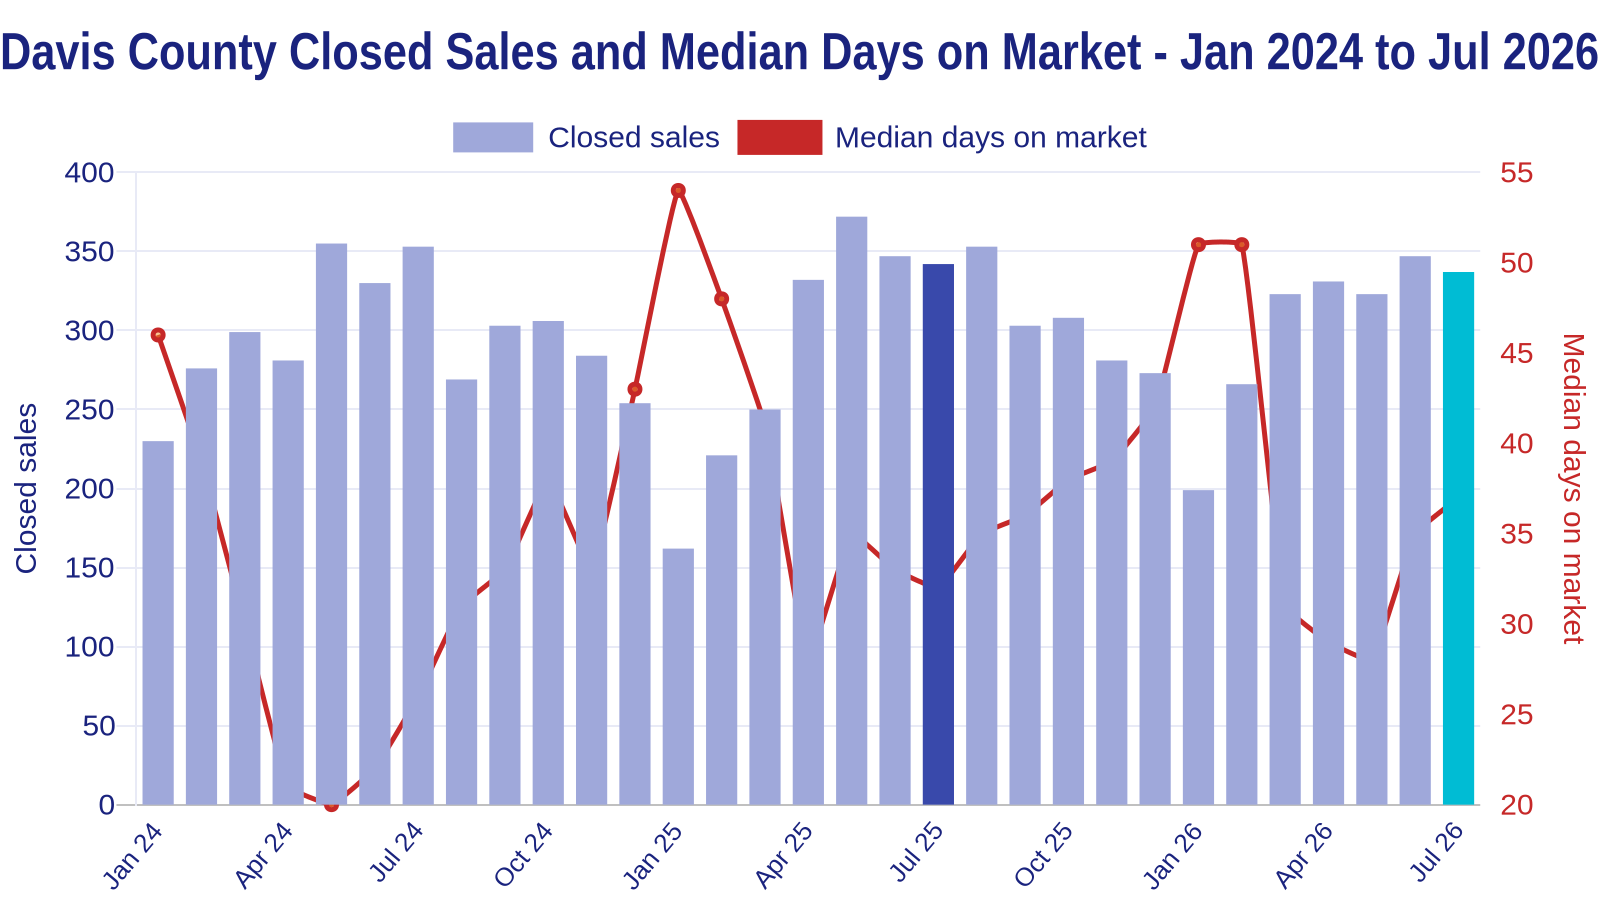
On July 31, Davis County had 1,014 active residential listings, compared with 873 on the same date in 2025 — a 16.2% increase. At the same time, listings under contract were down 20.1% year over year (270 vs. 338), and backup-offer listings rose to 112 from 89. More homes competing for attention, and fewer of them locked up under contract, is the clearest supply-and-demand signal in this month’s data. It also shows up in market time: the median July sale spent 37 days on market, five days longer than in July 2025.
What I’m Seeing in the Field
The gap between the median original list price ($550,000) and the median sold price ($532,000) is where July’s market discipline shows. Sellers who priced at the last comp’s number and waited saw their days-on-market stretch; sellers who priced to the current buyer pool still commanded 97% of original list, a tick better than last July. Closings held within 1.5% of last year’s July count, so demand has not stepped back — buyers are simply distributing across a larger menu of homes and negotiating harder on the listings that sit.
The Bigger Picture
Davis County’s inventory build tracks the statewide pattern. Across Utah, active residential listings averaged 14,296 per day in July 2026, up from 13,511 in July 2025, according to UtahRealEstate.com’s market analysis data. Davis County’s 16% inventory growth is coming off a comparatively low base, and its price-per-square-foot figure continued to edge up year over year even as raw medians stayed flat. A market where supply grows while prices hold essentially flat is a market finding equilibrium, not one tipping over.
What This Means for Buyers
Buyers have more selection than they had a year ago and more room to negotiate on homes that have accumulated market time. The median sale still closed at 97% of original list, so well-priced homes are not being discounted deeply — but the 37-day median market time means fewer bidding-war conditions and more opportunity for inspections, appraisal contingencies, and seller concessions to survive the negotiation. Watching new inventory closely matters more in a rising-supply market; you can browse the newest Davis County listings as they hit the market to see this selection firsthand.
What This Means for Sellers
The sellers who closed in July at 97% of original list did so by pricing into the market they are actually in: 1,014 competing listings, up 16% from last July. The data draws a sharp line between homes priced to the current comparable sales — which still moved in five weeks at strong ratios — and homes priced to 2025 expectations, which fed the growing days-on-market number. With under-contract counts down 20% year over year, positioning, presentation, and week-one pricing carry more weight than they have at any point in the past two years.
Methodology and Sources
Closed sales, median sold price, median original list price, sold-to-original-list ratio, median days on market, price per square foot, dollar volume: WFMLS data via the UtahRealEstate.com Sales Per Month Report, Davis County, Utah, residential; monthly figures for January 2024 through July 2026; medians; the report includes listings with a list price between $15,000 and $10,000,000 and a sold price within 25% of list; retrieved September 2, 2026. A parallel UtahRealEstate.com Market Summary Report for all residential sold listings with a sold date of July 1–31, 2026 (no price filters) shows 340 closed sales, a $530,000 median, and 36 median days on market; the small difference reflects the Sales Per Month Report’s outlier filters. Active, under-contract, backup, and coming-soon counts: UtahRealEstate.com Daily Snapshot Report, Davis County residential, as of July 31, 2026, with July 31, 2025 comparison; retrieved September 2, 2026. Statewide inventory: UtahRealEstate.com Market Analysis (utahrealestate.com/marketstats), average active residential listings per day by month; retrieved September 2, 2026. Sales may be reported to the MLS up to five business days after closing; figures are subject to revision. All data obtained from various sources and not verified by broker or MLS.